
Over the past few weeks, Wall Street has started to take a harder look at a market that, until recently, could do no wrong: private credit.
With interest rates staying higher for longer and parts of the technology sector losing momentum, investors are becoming more sensitive to risk across this US$2 trillion asset class.
In Q1 2026, several large private credit funds saw a noticeable increase in redemption requests. BlackRock, Blackstone and Blue Owl all implemented liquidity management measures within a short period.
There’s been no broad-based deterioration in credit quality, but the shift in sentiment is enough to raise a fair question:
Is private credit entering a stress cycle?
It Started in Tech, Not Credit
The change in tone didn’t begin in credit markets. It started in equities.
In early February, concerns around AI disrupting the software sector triggered a sell-off in US tech stocks, with SaaS names hit hardest.
Given a meaningful portion of North American private credit is deployed into tech and software businesses, that repricing quickly flowed through to credit.
Nothing “broke” at the asset level, but investor perception shifted. And in private markets, perception drives liquidity.
Blue Owl: Sentiment Moves First
Blue Owl was first to feel it, one of the largest direct lenders to the SaaS sector, managing over US$300 billion in assets.
When sentiment turned, its tech-focused vehicle, Blue Owl Technology Income Corp (OTIC), saw a spike in redemption requests despite no observable deterioration in underlying loans.
Source: Blue Owl
In response, Blue Owl announced a buyback of over 15% of the fund’s NAV and sold approximately US$400 million in assets (around 6% of NAV) to free up liquidity and stabilise investor confidence.
BlackRock: Structural Gating
Pressure then extended to larger platforms.
On 6 March, BlackRock’s HLEND fund triggered its redemption gate. With redemption requests reaching 9.3%, exceeding the 5% quarterly cap, only partial redemptions were fulfilled, with the remainder deferred.
It’s worth being clear about what a redemption gate actually is. It’s a structural mechanism designed to stop short-term capital flows from destabilising a long-duration portfolio. It does not, in itself, imply that the underlying assets are impaired.
Blackstone: Writing a Cheque to Hold the Line
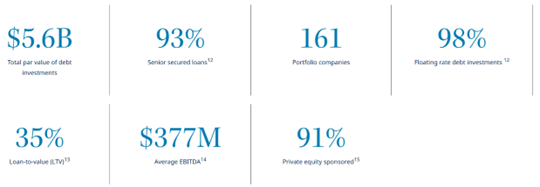
A similar dynamic played out at Blackstone Private Credit Fund (BCRED), one of the largest direct corporate lending vehicles in the world with around US$82 billion in total assets.
BCRED received redemption requests of roughly 7.9% in Q1 2026. To shore up confidence and keep liquidity intact, Blackstone increased the redemption cap from 5 per cent to 7 per cent and injected approximately US$400 million of internal capital.
This episode reflects a release of liquidity pressure rather than a systemic deterioration in asset quality.
Private credit is, by design, a low-liquidity asset class. Redemption gates, withdrawal limits, and deferral arrangements were baked into fund terms from day one. They’re part of the product structure, not a sign something has gone wrong.
Unlike listed bonds, private credit is not intended to be freely traded in public market. This illiquidity is not a flaw, but a source of compensated return that investors accept lower liquidity in exchange for higher risk premium.
Let’s Be Clear: This Is Not 2008
Whenever stress emerges in credit markets, comparisons to the Global Financial Crisis are inevitable. But structurally, the parallel does not hold.
The 2008 crisis was not simply a housing downturn, it was a systemic failure driven by the interaction of scale, leverage and, critically, mispriced risk.
At its core was the subprime mortgage market, where low-quality loans were packaged into increasingly complex securitised products, CDOs, tranches and re-tranches, and distributed across the global financial system. Through layers of leverage and re-investment, these exposures became embedded in bank balance sheets, institutional portfolios and funding markets. By the time the system began to unwind, aggregate exposure had grown to well over US$10 trillion.
Crucially, risk was not just present – it was obscured.
Credit quality was systematically overstated through flawed ratings processes, with securities backed by subprime loans frequently assigned investment-grade, even AAA, ratings. This created a structural mismatch between perceived and actual risk. When defaults began to rise, losses did not remain contained at the asset level. They propagated through a highly leveraged and interconnected system, triggering forced deleveraging, liquidity freezes and, ultimately, systemic instability.
The current private credit market differs on each of these dimensions.
First: the scale comparison simply doesn’t hold up.
First, scale remains materially smaller.
At approximately US$2 trillion globally, with roughly 75% concentrated in the United States, private credit, while growing, is still a fraction of the pre-GFC securitised mortgage market.
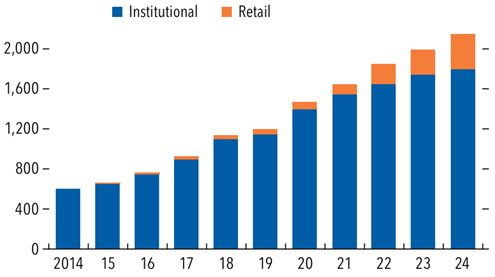
Source: IMF Global Financial Stability Report (2025), Capital IQ, PitchBook
Second, the location of risk has shifted.
Today’s exposures are largely concentrated within non-bank financial institutions, pension funds, insurers and other long-term capital providers, rather than highly leveraged deposit-taking institutions. This significantly reduces the likelihood of systemic transmission.
Third, the structure is more transparent and less reliant on leverage.
Direct lending now accounts for approximately 52% of the market, up from just 18% in 2010, providing investors with far greater visibility into underlying borrowers and loan terms. Private credit funds also typically operate with lower leverage and minimal reliance on short-term funding. With long-duration capital as the dominant funding source, the conditions for rapid and contagious risk transmission are fundamentally different.
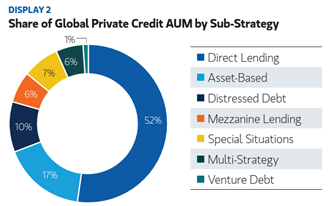
Gross invested assets inclusive of leverage applied. Excludes uncalled capital in drawdown funds. As of September 30, 2025.
However, the most important distinction lies in how risk is priced.
The 2008 crisis was not simply about poor asset quality, it was about systematic mispricing. Subprime mortgages were repackaged into complex securities and, through flawed ratings processes, treated as near risk-free assets. This disconnect between risk and pricing was structural and pervasive.
When defaults began to rise, losses cascaded through a highly leveraged system.
The data makes this clear. The subprime crisis did not unfold all at once, it began with the weakest credits and spread outward. Default rates on subprime mortgages originated in 2006 and 2007 rose sharply to above 20%, while prime mortgage delinquencies remained comparatively contained.
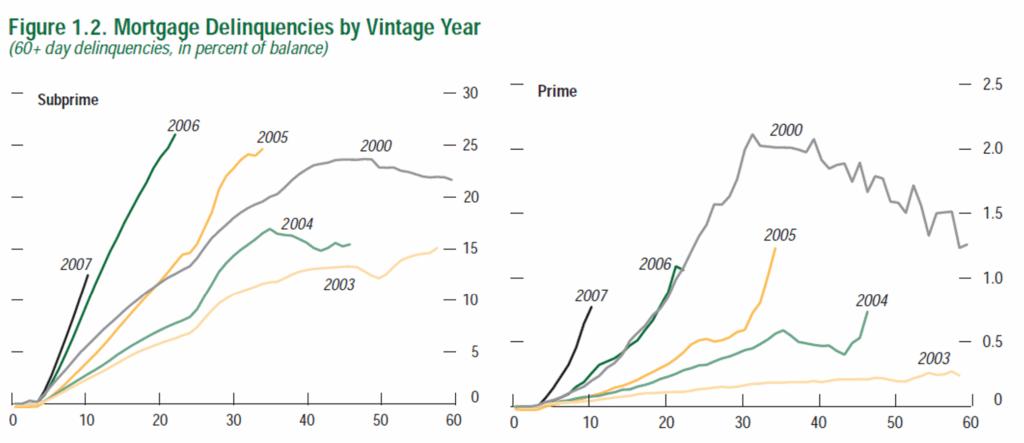
Source: IMF Global Financial Stability Report (2008), Merrill Lynch, LoanPerformance
At the same time, pricing across mortgage-related securities diverged dramatically. Lower-rated BBB securities declined sharply, while even instruments structured and rated as AAA suffered significant losses. As underlying asset quality deteriorated, the structures designed to isolate risk failed, allowing losses to migrate up the capital stack and ultimately destabilise supposedly high-quality assets.
By contrast, 30-year agency and jumbo mortgage assets remained relatively resilient, highlighting the importance of underlying asset quality and the differentiation of risk across credit tiers.
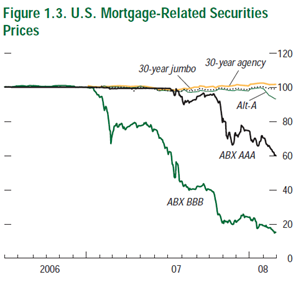
Note: ABX = an index of credit default swaps on mortgage-related asset-backed securities
Today’s private credit market operates on a fundamentally different footing.
Private credit is explicitly recognized as a higher-risk, illiquid asset class. Yields reflect credit risk, illiquidity premium and structural complexity. Over the past decade, it has delivered higher returns than high-yield bonds, corporate debt and even real estate, often with comparable or lower volatility, indicating stronger risk-adjusted performance.
In other words, risk is not hidden, it is priced.
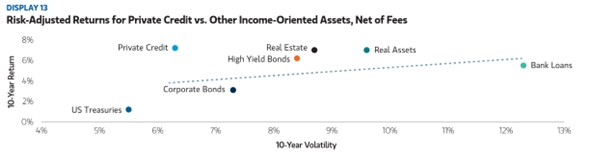
Private asset performance reflects fund returns net of fees and desmoothed to remove artificial effects of late reporting of fluctuations in underlying fair values. As of September 30, 2025.
One More Distinction Worth Making: Liquidity Risk ≠ Credit Risk
It is critical to distinguish between liquidity pressure and underlying asset quality.
Redemption constraints in private credit reflect the long-duration nature of the asset class, not necessarily a deterioration in credit fundamentals.
At the asset level, North American private credit is fundamentally corporate credit exposure. Even if growth slows or valuations compress, lenders retain priority claims over cash flows and capital. They are not exposed to equity downside in the same way as shareholders.
At the macro level, all credit assets face headwinds during periods of economic slowdown. However, the US economy continues to demonstrate resilience. Current conditions point to sector-level dispersion rather than broad-based deterioration.
The more relevant question is not whether redemption pressure subsides in the near term, but how the corporate credit environment evolves over the next two to three years, and whether the private credit market can navigate a full credit cycle following a decade of rapid expansion.
In that context, recent developments are better understood as a liquidity- and sentiment-driven stress test, rather than a precursor to systemic instability.
Bringing It Back to Australia: The Underlying Asset Is Everything
Having considered the dynamics of North American private credit, the more important point for Australian investors is this:
Private credit is not a single asset class. Its risk profile is determined by its underlying assets.
In North America, private credit is predominantly corporate lending, where risk is driven by business performance and credit cycles.
In Australia, the dominant model is fundamentally different: real estate-backed lending.
Here, loans are typically secured against land, residential developments or commercial property. Credit risk is therefore linked not only to borrower cash flow, but critically to the value and recoverability of the underlying asset.
North American private credit asks:
Can the business continue to generate earnings?
Australian real estate credit asks:
If the borrower fails, can the asset repay the loan?
Both fall under the umbrella of “private credit”, but the risk exposures are fundamentally different.
Why Asset-Backed Lending Matters
Australian private credit is structured around asset security, which materially changes the risk profile.
Investors/Lenders typically hold first-ranking mortgages or enforceable security interests over identifiable assets, providing a clearer framework for both risk assessment and recovery.
This offers three key advantages:
- Observable value: Property does not trade with the frequency of equities, but it is far from opaque. Comparable transactions, location, development potential, construction progress and rental income all provide tangible reference points for valuation.
- Strong legal position: In a properly structured transaction, lenders hold a first registered mortgage over real property. In a default scenario, enforcement rights are well-defined and legally enforceable, giving lenders greater control than in a typical corporate credit situation.
- Realistic exit pathways: Land can be sold. Residential stock can be liquidated. Partially completed projects can be transferred to replacement developer or incoming purchaser. The process may not be immediate, but the pathway is tangible and executable.
The key point is not that defaults do not occur, but that outcomes are generally more measurable and more recoverable. This creates a fundamentally different risk profile compared to North American corporate credit.
Conclusion
Australia’s residential property market is underpinned by a structural imbalance: demand continues to outpace supply.
Population growth, migration and household formation continue to drive demand, while planning and zoning approval constraints, construction costs and labor shortages limit supply.
This imbalance does not eliminate cycles, but it does provide a strong underlying foundation for asset values over the long term.
For credit investors, the critical question is not whether property prices always rise, but whether, under stress, assets remain saleable and capable of supporting capital recovery.
In Australia, the answer is typically yes.
The strength of Australian private credit lies not in real estate per se, but in its ability to anchor risk in tangible, assessable assets within a market supported by strong fundamentals.
That is the fundamental distinction.
And it is why Australian real estate-backed lending and North American corporate private credit, while often grouped together, should not be assessed through the same lens.
Author: Rebecca Gong
免责声明:博满集团(Boman Group Pty Ltd, ACN 624 683 325)子公司博满资本(BMYG Capital Pty Ltd, ACN 609 379 044) 是澳大利亚金融执照持有人(AFSL:505332),基金投资经理博满资管(Boman Asset Management Pty Ltd,ACN 133 561 887)是博满资本的授权代表(AFS No. 1275633)。基金产品仅接受专业/机构投资者(《公司法》所指),不接受零售投资者。对于本文件中包含的任何信息、观点和结论的准确性、及时性或完整性,博满集团不作任何陈述或保证。任何前瞻性陈述并非对未来业绩的保证或陈述,切勿过分依赖。基金为风险投资,请详细阅读基金投资备忘录对投资风险进行评估,投资者有失去本金投资的风险。本文件中所含信息仅为一般信息,不构成财务、税务或法律咨询意见或预测,未考虑个人目的、财务状况或个人需求。在按照本文所含信息采取行动或进行任何申购或持有金融产品决策前,您应基于个人投资目的、财务状况或个人需求考虑本文所含信息的适用性。更多基金产品详情请参阅基金投资备忘录,最终解释权归博满集团所有。